


The Monitoring Bill Nobody Planned For
Monitoring is one of those investments almost every engineering team gets right in the early days. A handful of virtual machines, a few production applications and a growing customer base make platforms like Datadog and New Relic an easy decision — deployment takes minutes, dashboards are ready out of the box, and there's very little infrastructure to manage.
The challenge appears later, as infrastructure expands and the number of monitored hosts, containers, services, databases, and Kubernetes clusters grows with it. Monitoring quietly evolves from a small operational expense into one of the largest recurring infrastructure costs, and for many organisations the first sign isn't an engineering discussion — it's a finance question: why has monitoring become one of our most expensive monthly subscriptions?
That question is pushing a growing number of UK organisations to reassess whether SaaS monitoring still represents the best long-term value, or whether a self-hosted platform built on Prometheus, Grafana, and Alertmanager alongside long-term storage tools like Thanos, Grafana Mimir or VictoriaMetrics would serve them better.
What Is Self-Hosted Monitoring?
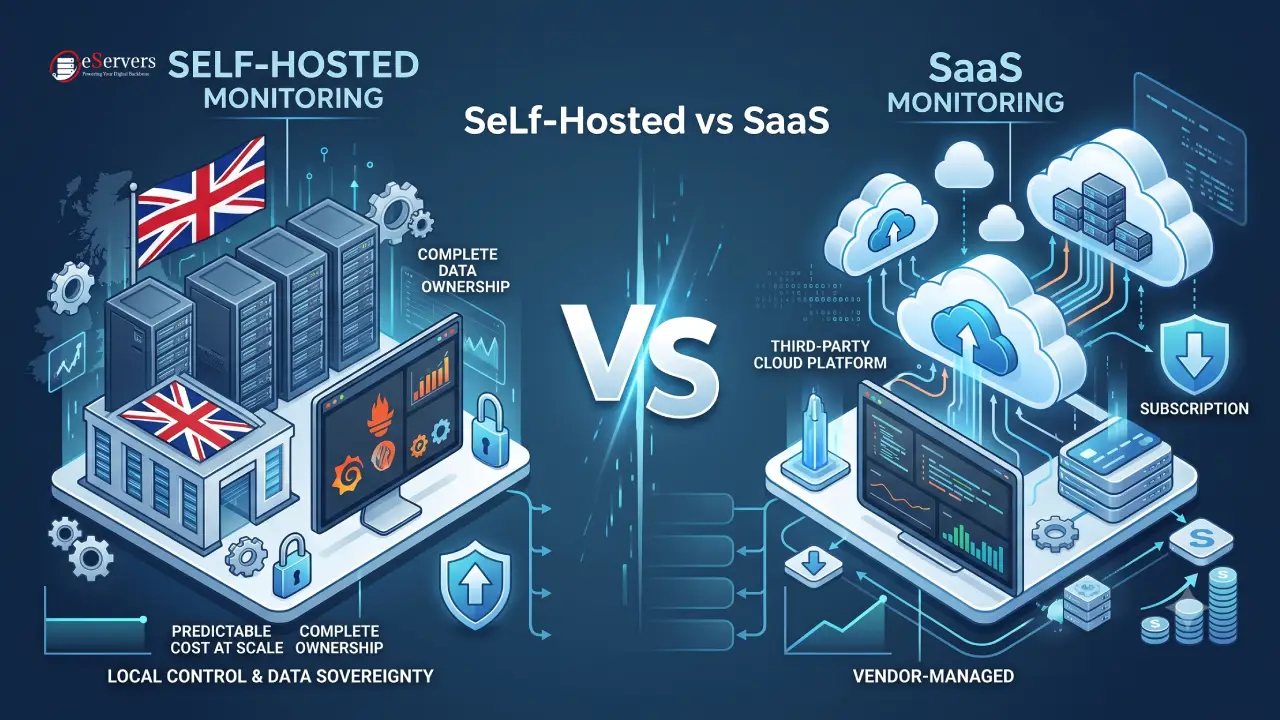
Self-hosted monitoring means your organisation owns and operates the entire observability platform instead of sending operational data to a third-party SaaS provider. Every component runs on infrastructure you control — often dedicated servers or private cloud environments inside UK data centres, giving engineering teams complete visibility into both the platform and the data it produces.
Prometheus — collects time-series metrics from applications, operating systems, containers, databases and network devices via exporters such as Node Exporter, cAdvisor and Blackbox Exporter.
Grafana — turns raw metrics into dashboards covering CPU usage, storage performance, latency, and hundreds of other operational metrics.
Alertmanager — groups related incidents, suppresses duplicate notifications, and routes alerts through Slack, Microsoft Teams, PagerDuty or email.
Thanos, VictoriaMetrics, or Grafana Mimir — extend Prometheus's retention and enable horizontal scaling for long-term historical data.
SaaS Monitoring vs Self-Hosted Monitoring
There's a common misconception that self-hosted monitoring is automatically superior. In reality, SaaS platforms became successful because they solve genuine operational problems — straightforward deployment, largely automatic scaling, vendor-handled maintenance, and support when things go wrong. For organisations running a handful of servers, the monthly subscription is often cheaper than the engineering effort required to build an equivalent platform internally.
The important question isn't "should everyone self-host?" It's whether your current monitoring strategy still aligns with the size, complexity and economics of your infrastructure as it exists today, not as it existed when the platform was first chosen.
| Feature | SaaS Monitoring | Self-Hosted Monitoring |
|---|---|---|
| Initial setup | Very fast | Moderate |
| Monthly costs | Subscription-based | Infrastructure-based |
| Scaling costs | Increase with usage | Primarily hardware growth |
| Data ownership | Vendor-managed | Fully owned |
| Data residency | Vendor dependent | Fully controlled |
| Infrastructure control | Limited | Complete |
| Long-term cost predictability | Moderate | High |
There is no universal winner. The better option depends on how your organisation balances convenience, cost predictability and operational control.
Why Data Sovereignty Has Become a Strategic Requirement
Monitoring data is frequently underestimated. It rarely contains payment records, but it can reveal internal IP addresses, hostnames, network topology, Kubernetes namespaces, and deployment schedules — together, an accurate map of your infrastructure. For businesses in healthcare, financial services, legal services, or the public sector, knowing exactly where this operational data resides has become increasingly important.
Keeping monitoring platforms inside UK infrastructure simplifies compliance conversations around UK GDPR, data residency, client due diligence, and supplier assessments — organisations retain complete ownership from collection through to retention, rather than asking a third-party vendor where the data actually sits.
Why Dedicated Infrastructure Suits Self-Hosted Monitoring
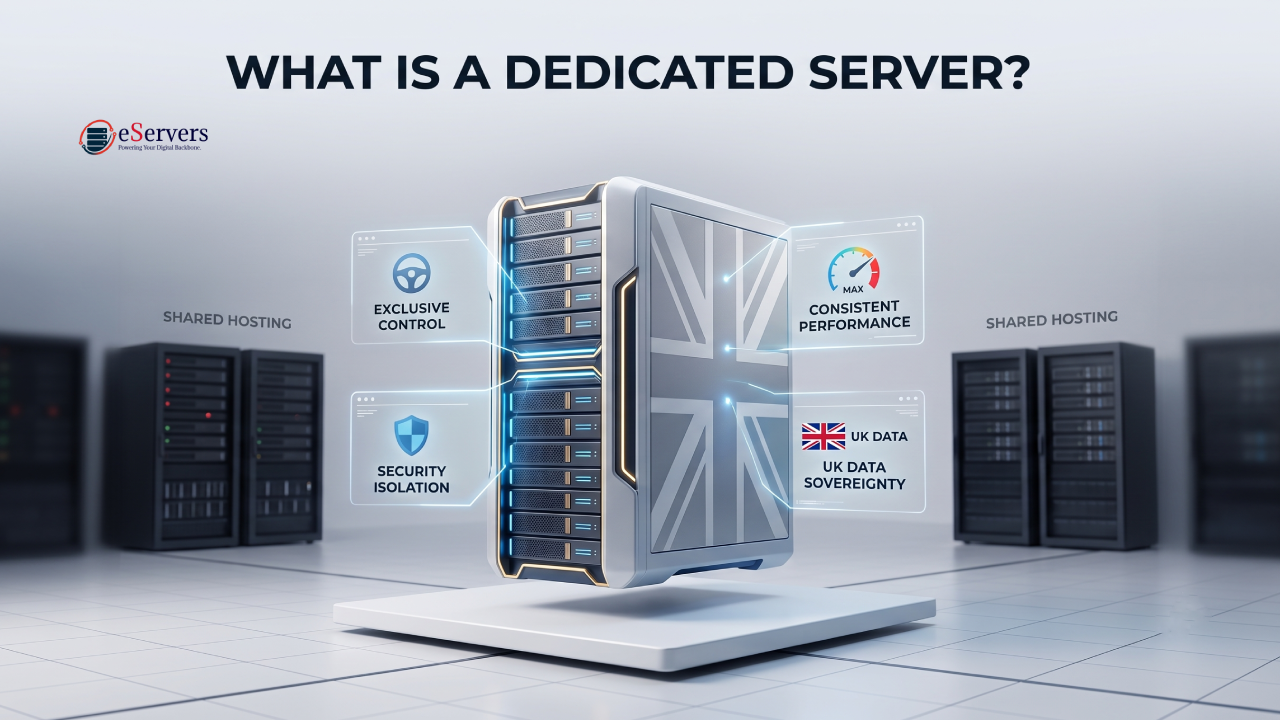
Monitoring platforms continuously ingest and query large volumes of metrics. Dedicated servers provide the consistent CPU performance, predictable memory allocation, and high-speed NVMe storage needed to support sustained ingestion without resource contention — a meaningful advantage over burstable virtual environments as historical retention grows.
Private networking between database servers, application clusters, and the monitoring stack keeps metrics traffic isolated from public internet traffic while reducing latency between exporters, Prometheus instances, and long-term storage.
When Does Self-Hosted Monitoring Become the Better Choice?
Self-hosting often becomes attractive when:
Monitoring costs increase faster than infrastructure costs.
Multiple teams require unrestricted dashboards and alerting.
Compliance requirements demand greater control over operational data.
Existing infrastructure teams already manage databases and production servers.
Long-term metric retention becomes expensive under subscription pricing.
SaaS monitoring continues to make sense when infrastructure remains relatively small, engineering resources are limited, or rapid deployment matters more than cost optimisation.
A Practical Migration Strategy
Phase 1 — Mirror critical metrics into Prometheus alongside the existing SaaS platform, without disrupting current operations.
Phase 2 — Rebuild the most-used dashboards in Grafana so teams get comfortable with the new environment.
Phase 3 — Migrate alerting rules into Alertmanager gradually, validating routing before fully cutting over.
Phase 4 — Introduce long-term storage (Thanos, Mimir, or VictoriaMetrics) for scalable retention.
Phase 5 — Retire the SaaS platform only once infrastructure, dashboards, alerting and retention have all been proven under real load.
Common Mistakes When Moving to Self-Hosted Monitoring
Treating monitoring as a weekend project rather than production infrastructure in its own right.
Collecting every available metric instead of focusing on what genuinely reflects system health and customer experience.
Ignoring capacity planning as retention and dashboard usage grow.
Forgetting that the monitoring platform itself needs redundancy — if Prometheus or Grafana goes down during an incident, engineers lose visibility exactly when they need it most.
Conclusion
Observability has evolved from a technical convenience into a business-critical capability. For many organisations, SaaS monitoring continues to deliver excellent value. For others — particularly businesses operating at scale, managing regulated workloads, or seeking greater cost predictability — a self-hosted observability platform provides increased flexibility, stronger data governance, and complete control over operational telemetry.
Infrastructure Considerations
A self-hosted monitoring stack performs best on dedicated servers for consistent ingestion performance, private networking to isolate metrics traffic, and NVMe storage for fast querying across long retention windows. Businesses migrating from an existing SaaS platform while keeping legacy hardware in the mix may also want to look at colocation options, alongside backup solutions for the monitoring platform's own data.
Frequently Asked Questions (FAQ)
Is self-hosted monitoring always cheaper?
Not necessarily. Open-source software removes licensing costs, but organisations still need infrastructure, storage, and engineering expertise. The real advantage is often predictable long-term costs and complete operational control rather than immediate savings.
Can Prometheus and Grafana scale for enterprise workloads?
Yes. With Thanos, Grafana Mimir or VictoriaMetrics, organisations can retain large volumes of historical metrics while supporting distributed, highly available monitoring architectures.
Is Prometheus better than Datadog?
Neither is universally better — Prometheus offers full control and predictable infrastructure-based cost, while Datadog offers faster deployment and vendor-managed maintenance. The right choice depends on team capacity and how the cost scales at your specific size.
How much does self-hosted monitoring cost?
Cost is primarily the compute, storage and networking needed to run the stack, plus engineering time for setup and maintenance. There's no per-metric or per-host fee, which is what makes cost more predictable as infrastructure scales.
Does monitoring data contain sensitive information?
It can. Metrics, logs and traces frequently include hostnames, internal IP addresses, and service names. Organisations with strict governance requirements often prefer keeping this information within infrastructure they directly control.
What infrastructure works best for self-hosted monitoring?
Dedicated compute resources, enterprise NVMe storage, private networking between monitoring components, and automated backups all help maintain consistent dashboard performance and reliable alert processing as environments grow.